
I took a wonderful one-day seminar by Edward Tufte a long while ago titled “Analyzing/Presenting Data/Information” and was blown away by the possibilities he opened inside my mind. I walked out of the seminar deeply inspired to create illustrations for my book beyond the standard linear timelines and black & white photos of the early scientists; I set a goal to include neither. I had rough, abstract ideas but lacked an artist to transform these ideas into illustrations. And then, through the recommendation of a friend, I discovered Carly Sanker, a wonderfully creative artist who had essentially zero background in thermodynamics. In her own words:
“When Bob first called me in March of 2018. I was living in San Francisco and for about two hours I stared out at the bay, pacing back and forth, looking out at the water, listening and talking, but mostly listening.
He explained his reasoning and the research that went into his book and he walked me through his vision for the illustrations—some of which he said had never been created. I was as excited as I was intimidated. Thermodynamics is so complex, it almost seems out of reach, I thought. Actually, he corrected me—it’s so complex that most experts with their PhDs in physics still struggle to truly understand the foundational concepts—so don’t feel bad. Now that blew my mind. Suddenly the problem seemed approachable: it wasn’t an information problem, it was a communication problem. The solution was already there, we just had to reveal it. I could handle that.
I dove in and Bob threw me a lifesaver. I was able to understand some of the simpler concepts touched on in the book from my high school physics career, but in the end I would require an on-site Professor Hanlon three-day “crash course” on thermodynamics—if you can imagine such a thing—in a shared workspace on Miami Beach of all places. It seemed like a lot to take on, because it was—but the secret to success was our focus on removing the tangential and revealing the essential. We would spend the following year creating, reviewing, simplifying and revising every illustration until for the umpteenth time we both said “ok, I think we’re actually really, finally done this time.”
I want to draw your attention to the set of my favorite illustrations of Carly’s, The Discovery Maps. I knew I wanted to created a timeline of milestone events for each of my book’s four parts: The Big Bang, The Atom, Energy, and Entropy, but again, wanted to create something new as opposed to the traditional linear approach. Carly and I worked together to create flowing, very non-linear timelines that invite the reader to discover how the history all came together for each of these parts. Carly aptly called these illustrations Discovery Maps.
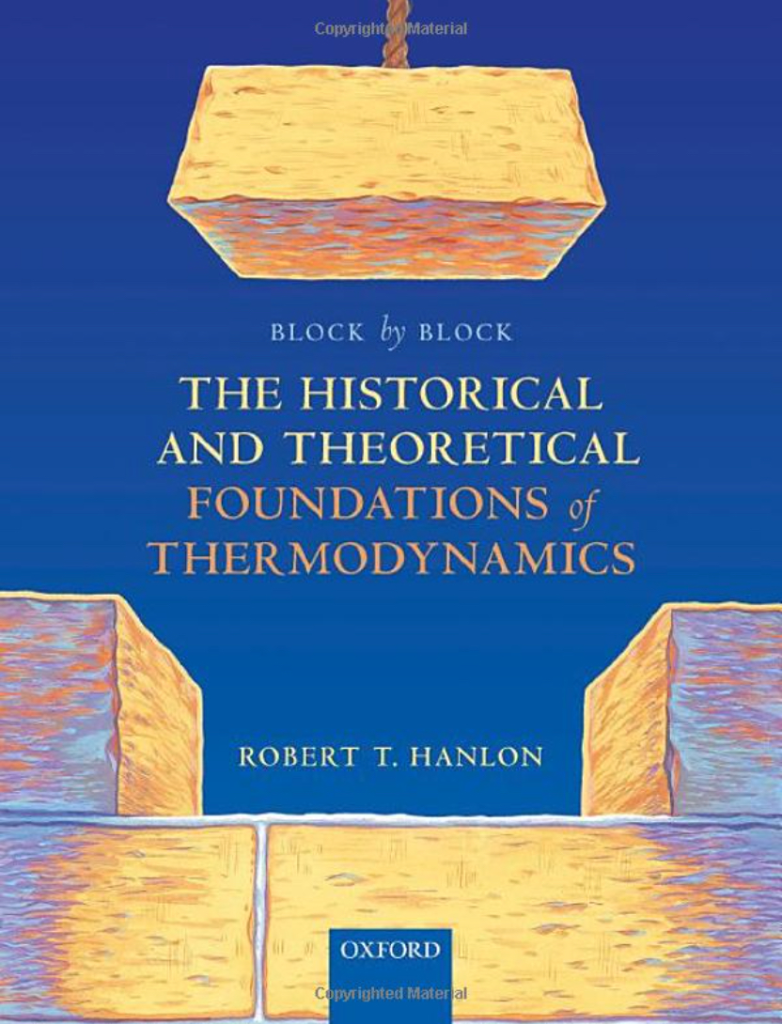
You can check out the Discovery Map we created to tell the history of the Big Bang in the google books link (here, p. 2 on the left side of the open book, p. 3 on the right) and you can also check out 1) the beautiful & colorful cover Carly created, and 2) an encompassing illustrated chemistry of both the Big Bang and the subsequent nucleosynthesis of the elements in the stars (same link, p. 8). All told, 32 original Discovery Maps and illustrations populate my book. We hope you’ll enjoy them!
Thank you again, Carly!

Leave a Reply